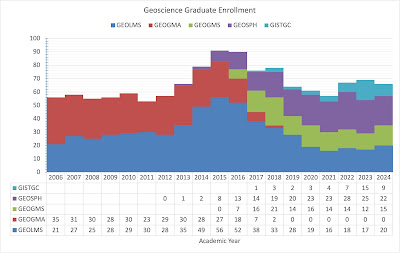
All plots represent Fall Semester enrollment data from UA Institutional Research and Assessment. Scope expanded to include enrollment, student semester credit hours, and diversity. Data tables added to several plots and data labels removed to improve clarity. Plots cover 2006-2023 or as far back as I have data. C Liner 9/21/2024


